Rob Hawley's Pages Almaden Observatory Main Page

North American and Pelican Nebulas (NGC 7000 + IC 5070) in NHO

June 2015 - September 2015

The North American Nebula (NGC 7000) is one of the most popular imaging targets in the northern hemisphere.  Almost every imager has a shot of it plus the nearby Pelican (IC 5070). Normally these images are either in color (L + RGB) or Hubble Palette (Suflur, Hydrogen, Oxygen).  My test shots of the nebula convinced me that using Nitrogen rather than Sulfur would make for more interesting image.

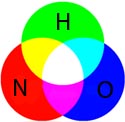
NHO palatte

In most narrowband images of this object the "Hydrogen" component is actually H + Nitrogen.  The Nitrogen line is close enough to the H alpha line that it requires a 3 nm filter like I am using to separate the two. Doing so opens the possibility of viewing a nebula in a different way.  Note that the Hubble also uses 3 nm filters so their Hydrogen is just Hydrogen.

The processing of these images was greatly influenced by the 2014 Katonah NY Pixinsight workshop.  Applying what I learned in Katonah gives an image that is much richer in color.  Without the color processing Green (Hydrogen) would dominate the image. The rich colors along the edges of the nebula become apparent in the more balanced image.  It should be noted that the final image no longer represents the amounts of the three elements.  It does make it easier to see the distribution of them.

NGC 7000 is famous in visual astronomy as being one of the few bright nebulae that you can not use an Oxygen III filter to observe.  Instead you have to use a H-Beta (the second line of Hydrogen).  The reason is simple.  The nebula is not rich in Oxygen.  Thus the oxygen (mapped to blue here) would be almost missing without aggressively amplifying it.

With the Katonah color calibration Nitrogen (the red color) becomes more dominant.  The yellows indicate areas of both higher Nitrogen and higher Hydrogen.  Note particularly the structures in "Mexico" and in the Pelican shown below. The Aquas in the "Texas" area show that the center does contain some Oxygen and is poorer in Nitrogen than the outer areas. Also note the dark dust lanes on the border of the "Gulf of Mexico" and in the Pelican.


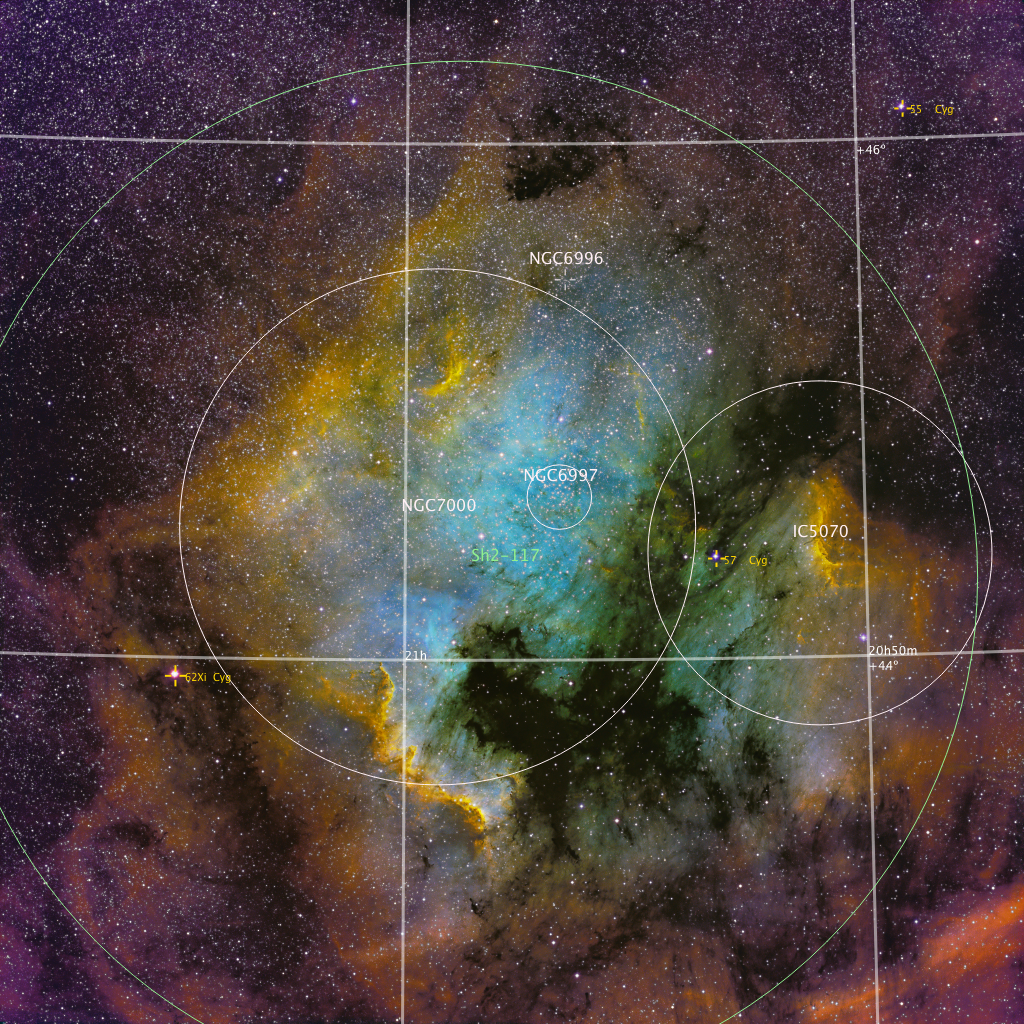
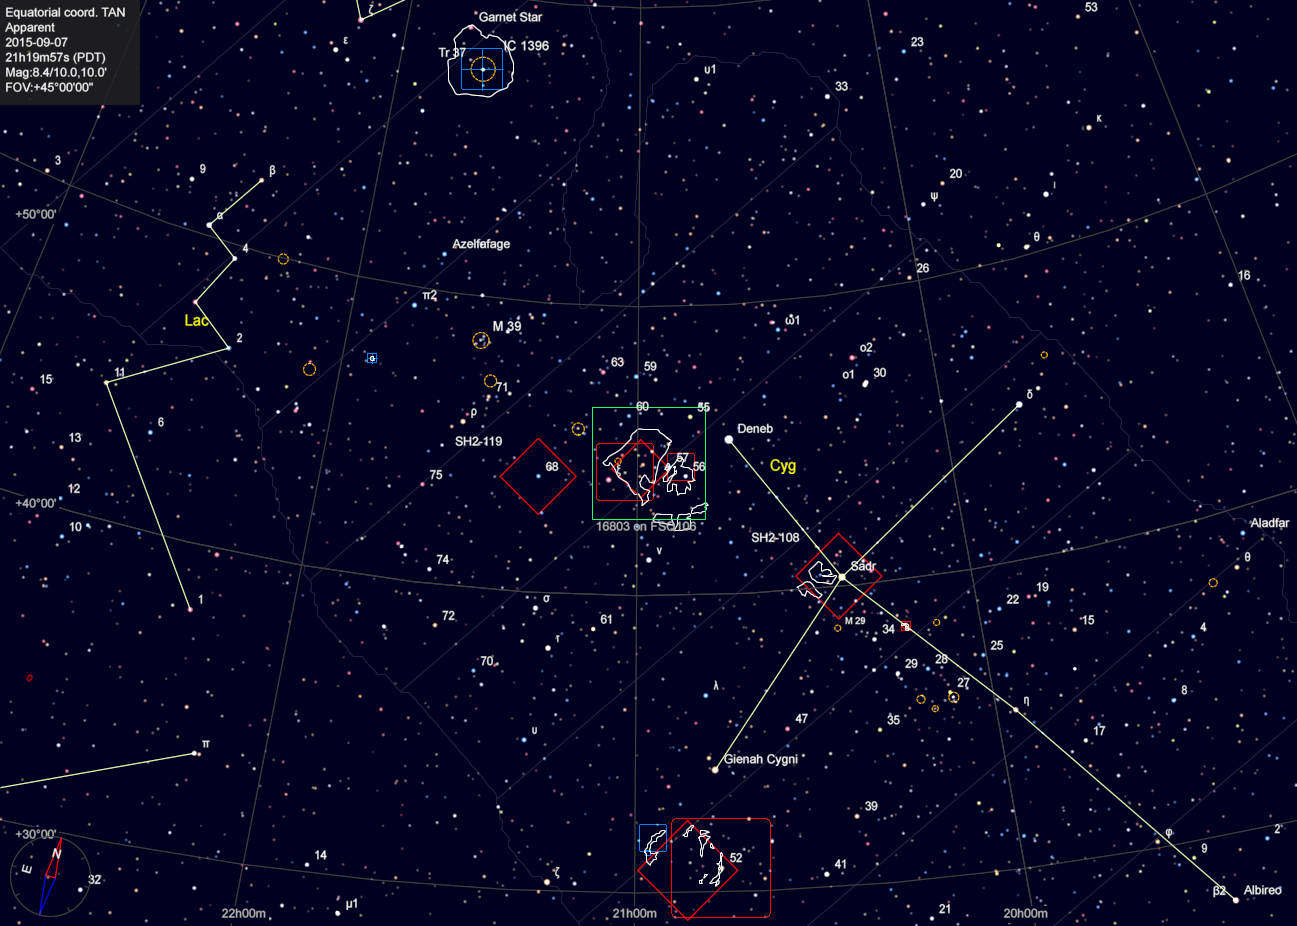
Area map of North American Nebula

click for a full size image

Annotated Image

Annotated Image of NGC 7000


Zoomable Image in NHO

The full size image is 4096x4096.  The following will allow the reader to zoom into the image to explore it more closely.

R=N G=H B=O

"Mexico" and "Texas"

This is a reduced resolution image of just the Mexico and Texas sections of the nebula.  Click for a full resolution.

"Mexico" portion of North American Nebula in NHO

Note the yellows (N+H) along the edges of the wall and the aquas (O+H) in the upper right.  Some regions contain enough Nitrogen to be reddish (with this processing).

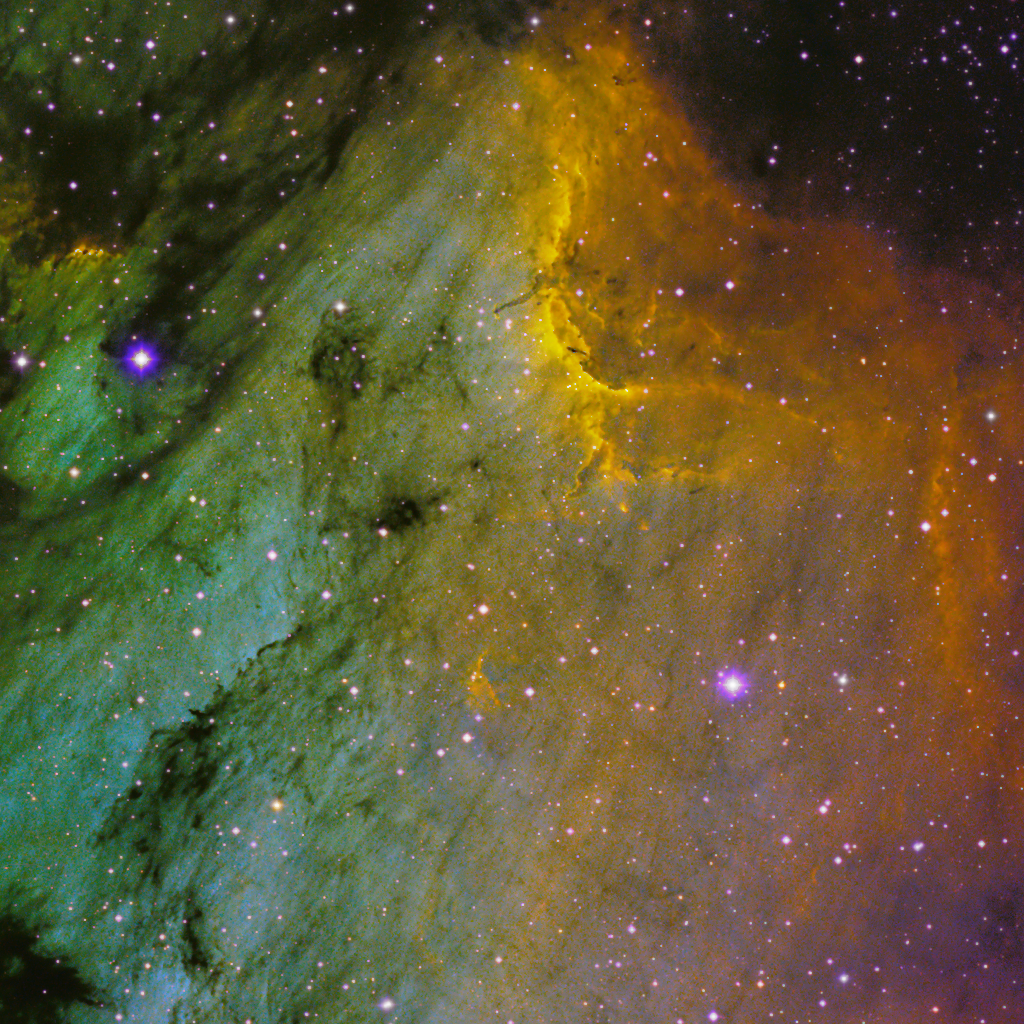
Pelican


The Pelican is on the other side of the "Gulf of Mexico" from the North American.  It contains one distinct wall with much structure.  The nebula also has many dark parallel dust lanes.  The crop below only shows a portion of these. Consult the full resolution image above for more information.

Heart Nebula

Processing Details


Data was collected between June 2015 and September 2015 at -25C.  This is the first project entirely done with APCC Pro self guiding the mount.  Images taken in June were with the AP900.  Images taken in August and September were with an 1100AE.  The final mix is about 50% 1100 with the 1100 displacing about the same number of 900 images due to the spot-on tracking.  No 1100 image was discarded for tracking.


Filter
Exposure
Hydrogen 22x900
Oxygen 20x900
Nitrogen 22x900

All images were processed by Pixinsight.  The sub frames were combined using the Linear noise rejection.

Converting the Raw Image into what you See


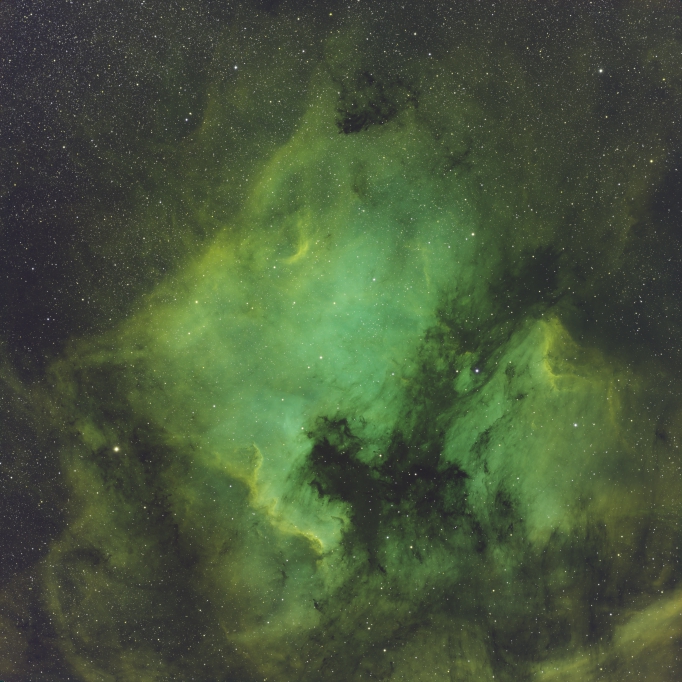
I thought it might be interesting to fully document what I did.  The image you see at the right is what the image looked like after combining the 3 channels.  While there are some hints at details to be revealed for the most part the image is flat and boring.  This section will describe the steps I did to convert that into what you see above.

Please also refer to the discussion in the Heart and Soul Nebula.  A number of the strategies are discussed there.

Processing has three major steps:

  • Linear - manipulating the image before stretching distorts the relationship between original and displayed brightness
  • Sharpening - A number of steps to bring out detail in the image
  • Fixing the stars - Go back and repair the display of the stars
Most of the operations in Pixinsight require correctly built masks.  Mask generation is an art.  Some combination of MLT, curves, Morphology, and convolution are used to generate the masks.  For each step I try to identify what is being masked.
What the raw image looks like
click for a larger image


Linear

The image starts as a linear image.  Originally this was a map of pixel intensities from 0-65535 for the surface of the CCD.  After combining the subframes these are floating point numbers with 0 corresponding to 0.0 and 65535 corresponding to some value <= 1.0.  Except for bright stars most of the image are values like .002.  Since the representation is floating point the accuracy is preserved.
Operation
Mask
Modification
Channel Combination
-
Join the merged Nitrogen, Hydrogen, and Oxygen together to form RGB image
Background Neutralization
-
Set the background levels the same for each color.  The background is now black
ColorCalibration
-
Adjust the levels of the three channels to make "white".  In this case I set the foreground sample to be several areas of the nebula. CC then adjusted the levels of each of the three channels.
Curves
~starmask4 - this mask is made of of several star masks.  It tries to include a sharp image of dim stars and more expanded images of brighter stars.  This reduces the impact of this step on the star images
Increase the saturation of the image.  This intensifies the colors
Curves
starmask4
removes any color in the images of the stars by setting the saturation to zero.
ImageSolver
-
Determine the location of the image and set the FITS parameters.  Important later when I try to annotate it.

Sharpening

Now we will make the image non-linear.  Some areas of the image will be affected more than others.  This is required to convert from the relatively low levels in the original to something that does not appear black on a computer screen (or INTEGER(256*intensity) ).  The order of operations is pretty much what I use on all images.  Of course the masks are custom built with much trial and error until I get the result I want.

Operation
Mask
Modification
HistogramTransformation
-
This step remaps the intensities of the original. This increases the intensities in the original image so the details are now brighter.  Think of this as curves on steroids.
HDRMultiscaleTransform
This mask is a combination of a stretched version of the intensities minus a mask of the stars.  This is done so more of the effect applies to the brighter sections of the image, but not the stars
This step brings out the subtle structure by remapping the intensities to bring out the structures hidden in the data.  At this point the two walls in "Mexico" and the Pelican become more obvious.  This is a writeup on a previous version of this algorithm.
Curves
Another mask that allows the bright areas to be modified, but protects stars
HDRMultiscaleTransform results in an image that is rather flat looking since it spreads the intensities over a larger range.  To fix this the saturation and luminance need to be increased. One needs to be careful so important details are brighter, but not saturated.  One also wants to increase not kill the contrast of the image.
Fix bright star
Masks for the two brights stars
Two particularly bright stars were repaired at this point.  I used PixelMath to replace the image of the star with a copy earlier in the processing.  I then desaturated the star to remove color
MultiscaleMedianTransform
bright areas minus stars
This is the first sharpening.  MMT works with wavelets.  I selected certain sizes of structures to be enhanced and others to be noise reduced.
MultiscaleMedianTransform midtones
Now sharpen and enhance the midtones of the image
Curves
everything not a star
again tweak the intensities and saturation
TGVDenoise
~ bright areas
Apply noise reduction.  Mostly applied to the dimmer areas (brighter areas were done above)
DarkStructureEnhance
generates its own masks
Brings out the dust lanes by finding and enhancing any dark/bright boundaries
Curves
shadows
lower the intensity of the shadows.  Adds contrast to the image
Curves

again a gentle tweak of intensity and saturation

Fixing the Stars

At this point the nebula looked great.  Some of the stars not so much.  Since this is a narrowband image the stars usually start with a purple hues and halos. From here to the end was a series of ad hoc improvements in the stars.

Operation
Mask
Modification
ColorSaturation
mask for 62cyg
I was still not happy with the brightest star.  Since the color of the halo was mostly purple I selectively removed reds and purples.  Other colors were untouched.  The result was that the diffraction spikes were now white.
Convolution
starmask
Some of the operations above made the stars have very sharp edges.  In this step I gently blurred the stars so they looked more star-like.
MorphologicalTransform
mid brightness stars
The mid level stars looked unnaturally large.  With this I reduced their size a bit.
ColorSaturation
mid brightness stars
remove the final bit of purple shadow where needed.

Copyrights For Photos

Creative Commons License
(c) 2015 Robert J Hawley.
Except as noted,all work on this site by Robert J. Hawley is copyrighted under a Creative Commons Attribution-Noncommercial-Share Alike 3.0 United States License. This permits the non commercial use of the material on this site, either in whole or in part, in other works provided that I am credited for the work.